On-Chain Data School (Part Four): Visualizing BTC UTXO Age Price Distribution Chart


Original Article Title: "On-chain Data Classroom (Part 4): Visualizing the $BTC Chip Price Distribution Chart "
Original Article Author: Mr. Berg, On-chain Data Analyst
This article is the 4th in the On-chain Data Classroom series, which consists of 10 articles in total. Take you step by step to understand on-chain data analysis. Interested readers are welcome to follow this series of articles.
Related Reading: "On-chain Data Classroom (Part 3): Have the Bottom Fishing Whales Taken Profit?"
TLDR
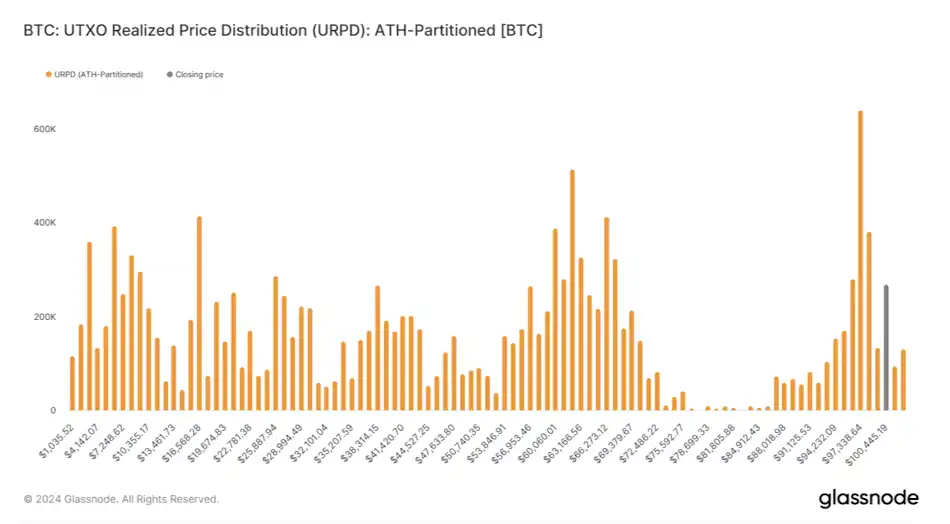
- This article will introduce the on-chain metric URPD
- URPD shows the distribution of $BTC chips at different holding costs
- URPD can be used to observe chip turnover, distribution conditions, and provide guidance on trends
What is URPD?
URPD, short for UTXO Realized Price Distribution.
Due to BTC's unique UTXO blockchain structure,
we can track data on-chain that is unavailable in traditional financial markets.
The URPD chart is an indicator derived from this principle,
where we can see the number of chips corresponding to each price level on the chart,
equivalent to showing the "buying cost of each $BTC."
URPD, Chip Turnover, Accumulation, and Distribution
After understanding the concept of URPD,
we can then observe the turnover of chips at different price levels based on the daily URPD changes.
For example:
Chart one below is the URPD chart for May 1,
while chart two is the URPD chart for October 1.
After experiencing five months of wide-ranging fluctuations in price,
It is quite obvious to see the phenomenon of low-cost chips being distributed upwards.

URPD, Chip Turnover, Accumulation, and Distribution (2)
In history, at a market top, it is usually accompanied by the tail end of high-profit low-cost chip distribution;
while at a market bottom, a large amount of chips can be seen accumulating in a relatively narrow range.
Therefore, in analysis,
URPD is often observed together with other data (such as realized profit, MVRV, etc.),
integrating logical thinking to understand the market from a more comprehensive perspective.

Support, Resistance, Consensus
When a significant amount of chips begins to accumulate in a single price range,
it indicates that a supply-demand consensus has gradually formed in that range.
Once the price later rapidly rises out of that range,
due to the high turnover of chips in that range,
it is likely to provide support in the future;
Conversely, if the price falls below that range,
the chips in that range will become trapped chips,
which may act as resistance levels in future price increases.
Conclusion
The above is all the content of On-Chain Data School (Part Four). For readers interested in delving deeper into on-chain data analysis, remember to keep track of this series of articles!
If you want to see more analysis and educational content on on-chain data, feel free to follow my Twitter handle (X)!
Hope this article has been helpful to you. Thank you for reading.
You may also like

Rented Belief: How Much of the Bitcoin ETF Fund Flow is Real Money

The two giants are racing in "credit": loan balances of 9.9 billion vs 14.6 billion USD, Brazil has become the main battlefield

A company that was on the verge of bankruptcy has just surpassed Bitcoin in market value

B.AI partners with MiniMax to launch a limited-time free experience of M3, enabling zero-threshold implementation of Agentic productivity through full-stack infrastructure

The second half of the computing power battle: Intel CEO Pat Gelsinger reveals how AI is reshaping the global semiconductor supply chain

WEEX Live mode: Monitor 20 trading pairs at once and trade like a pro

Morning Report | Secret Network loses $4.67 million due to cross-chain vulnerability; Michael Saylor releases Bitcoin Tracker information again, may disclose increased holdings data next week

Kalshi's biggest competitor is not Polymarket
WEEX Makes Affiliate Access Easier on the Web and in the App
Customize Your Spot Trading Page: Drag Modules and Move the Order Panel Where You Want It

Perp DEX: The Next Generation Exchange "War"

10 Counterintuitive Insights on Latin American Payments

The AI gamble of mining companies: Valuations enter a phase of differentiation, and it's hard to turn the tide
A letter from Alliance to entrepreneurs: Written on the occasion of Cursor selling for 60 billion dollars
Stablecoins Finally Find Real Returns: On-Chain Reinsurance Re Explained | Interview with Re Founder Karan Saroya

The impossible triangle is simply a pseudo problem

Will MicroStrategy fall into a death spiral? What will the macro trend be in the second half of the year?

